
OPENING QUESTIONS: Working SOLO (at first)-- See how far you can progress through the steps we outlined yesterday.... GO!
This can be MOST frustrating. That's ok. Honest!
LEARNING TARGET: I will construct a practice small amplitude tsunami graph during today's class
WORDS O' THE DAY:
- frequency (waves/second or waves/minute)
- period ("seconds/wave or minutes/wave")
- amplitude (wave height)
- wavelength (distance from crest to crest)
- crest (the highest point of the wave)
- trough (the lowest point of the wave)
- speed = (wavelength x frequency. NOTE: (meters/
wave) x (waves/sec) = meters/sec - tsunami
- subduction zone
TSUNAMI WAVE EQUATION:
WORK O' THE DAY:
VIDEO TUTORIALS:
- Getting raw DART "Event" data and turning it into usable data in Google Sheets is HERE
- Processing 'Small Amplitude Tsunami Data' is HERE
═══════════════════════════
THE PURPOSE OF THIS INVESTIGATION IS TO PRECISELY MEASURE THE FIVE WAVE CHARACTERISTICS OF THE SMALL AMPLITUDE TSUNAMI GENERAGTED BY THE JANUARY 2018 KODIAK EQ.
You will document your efforts in a 'Training Video' that you narrate showing:
- All the steps that you took to create your graph as outlined on this page
- The calculations you made to measure the five wave characteristics of that tsunami
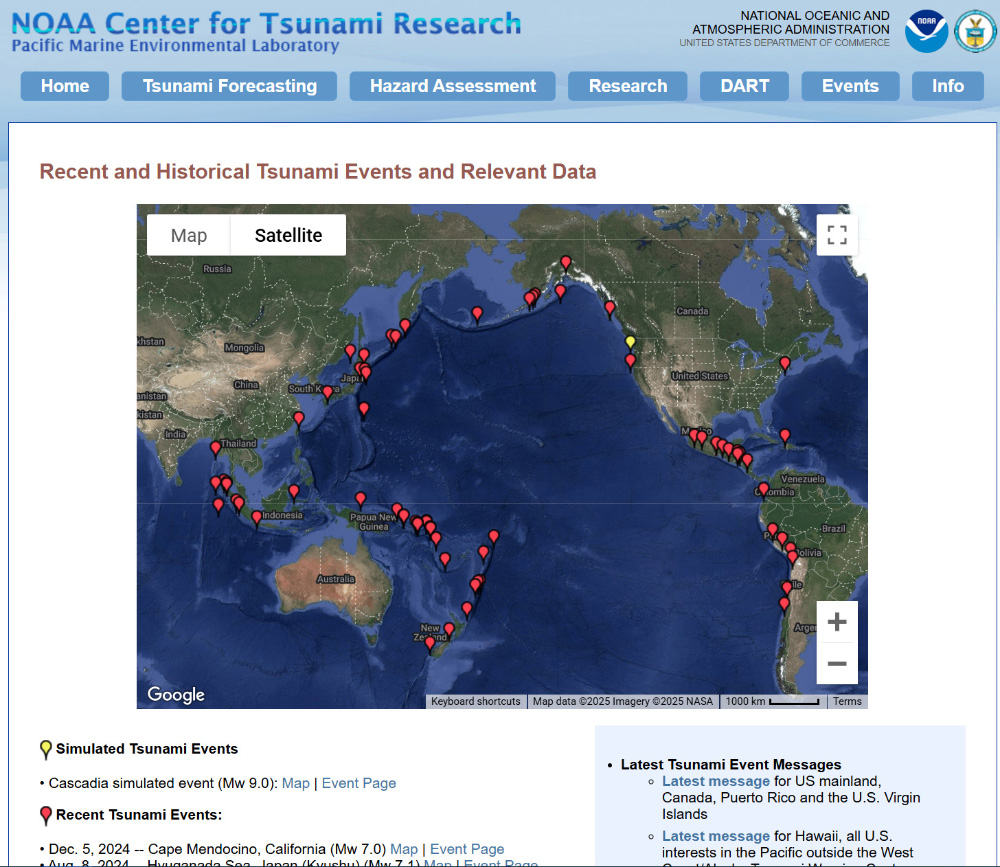
- Now find your way to the NOAA National Centers for Environmental Information National Hazards Viewer
-
Find buoy 46419 off the Pacific Northwest Coast. We will use the data from that buoy as the basis for this graphing project.
Let's take a look at our final result for our practice run:
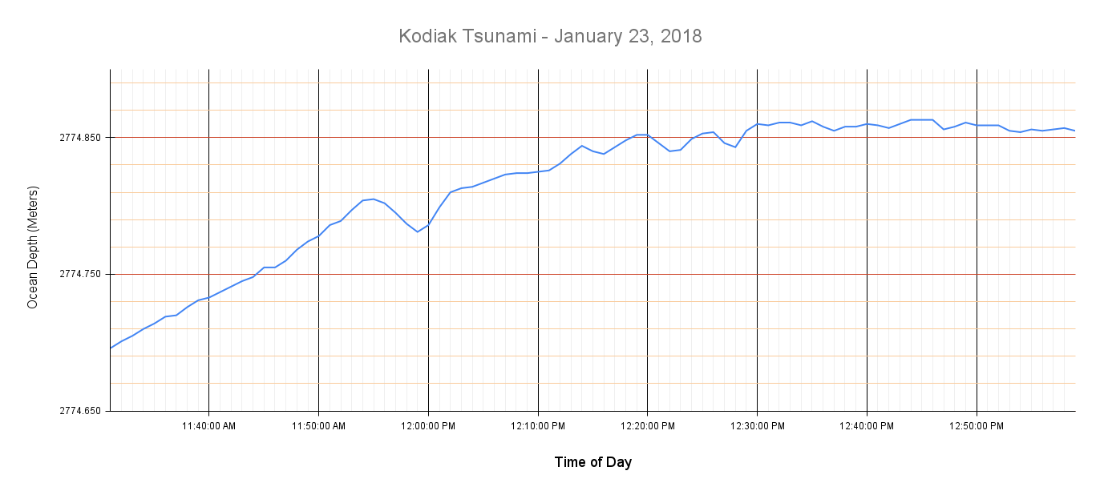
Your final graph should contain ALL of these elements but your numbers will, of course be different.